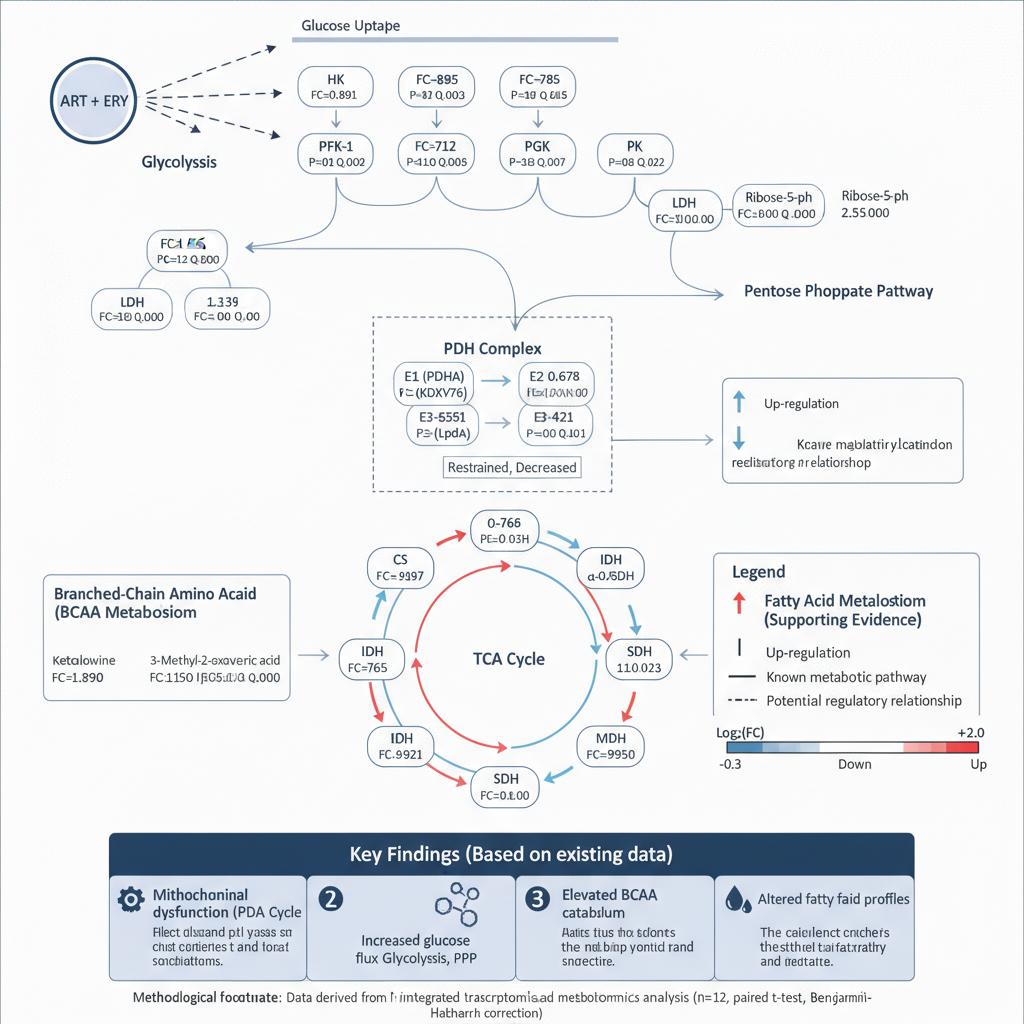
A high-resolution, professional scientific molecular mechanism pathway diagram for an academic publication, strictly rendered in a clean, modern vector illustration style using Times New Roman font throughout. The entire diagram uses full English text and precise standard academic abbreviations. The layout is optimized to match the complex interconnections of the provided source image. ### Overall Structure: - The top-left corner features the drug treatment icon labeled "ART + ERY" with multi-directional regulatory arrows (solid and dashed) pointing to key metabolic pathways. - The top section depicts "Glucose Uptake" on a cellular membrane, initiating the "Glycolysis" flow through standardized nodes like HK (Hexokinase), PFK-1 (Phosphofructokinase-1), PGK (Phosphoglycerate kinase), PK (Pyruvate kinase), leading to "Pyruvate" and branching to the "Pentose Phosphate Pathway" (marked G6PD and Ribose-5-ph) and "Lactate" (with LDH). - The central feature is a detailed, dash-outlined "PDH Complex" box with E1 (PDHA), E2 (KDXV76), and E3 (LpdA) subunits, including the annotations "Restrained, Decreased" for the LpdA data box. - The lower-center depicts a detailed circular "TCA Cycle" containing Acetyl-CoA, CS (Citrate synthase), IDH (Isocitrate dehydrogenase), alpha-KGDH, SCS (Succinyl-CoA synthetase), SDH (Succinate dehydrogenase), and MDH (Malate dehydrogenase), all with associated differential expression arrows. - On the left side, there is a distinct box for "Branched-Chain Amino Acid (BCAA) Metabolism" (showing Ketolouvine and 3-Methyl-2-oxovaleric acid). - On the right side, there is a box for "Fatty Acid Metabolism (Supporting Evidence)" (showing Pentadecane and 2,6,10-Trimethyl-dodecane). ### Data Rendering: - All key protein and metabolite nodes are enclosed in clean vector boxes showing precise, legible text: the node abbreviation, Fold Change (FC) value, P-value, and Q-value, preserving all numerical data from the original image (e.g., Pyruvate FC=3.763). ### Legend and Scale: - On the far right, there is a structured "Legend" box with standard icons for up-regulation (red arrow), down-regulation (blue arrow), known metabolic pathway (solid line), and potential regulatory relationship (dashed line). - Below the legend, a horizontal "Log2(FC)" color scale bar ranges from -0.3 (blue, Down) to +2.0 (red, Up). ### Findings Banner: - At the very bottom, a styled dark blue footer banner is titled "Key Findings (Based on existing data)" and is divided into four numbered, icon-labeled summary cards, preserving all descriptive text from image_4.png. - Below the banner, a small methodological footnote is clearly visible. ### Design Requirements: - The color palette is a professional medical aesthetic (soft blue, grey, white) with distinct red and blue highlighting for up- and down-regulated data boxes and arrows. All connections must be vector-sharp and aligned, with absolutely no Chinese characters and perfect Times New Roman typography.

@ww ww
Prompt
A high-resolution, professional scientific molecular mechanism pathway diagram for an academic publication, strictly rendered in a clean, modern vector illustration style using Times New Roman font throughout. The entire diagram uses full English text and precise standard academic abbreviations. The layout is optimized to match the complex interconnections of the provided source image. ### Overall Structure: - The top-left corner features the drug treatment icon labeled "ART + ERY" with multi-directional regulatory arrows (solid and dashed) pointing to key metabolic pathways. - The top section depicts "Glucose Uptake" on a cellular membrane, initiating the "Glycolysis" flow through standardized nodes like HK (Hexokinase), PFK-1 (Phosphofructokinase-1), PGK (Phosphoglycerate kinase), PK (Pyruvate kinase), leading to "Pyruvate" and branching to the "Pentose Phosphate Pathway" (marked G6PD and Ribose-5-ph) and "Lactate" (with LDH). - The central feature is a detailed, dash-outlined "PDH Complex" box with E1 (PDHA), E2 (KDXV76), and E3 (LpdA) subunits, including the annotations "Restrained, Decreased" for the LpdA data box. - The lower-center depicts a detailed circular "TCA Cycle" containing Acetyl-CoA, CS (Citrate synthase), IDH (Isocitrate dehydrogenase), alpha-KGDH, SCS (Succinyl-CoA synthetase), SDH (Succinate dehydrogenase), and MDH (Malate dehydrogenase), all with associated differential expression arrows. - On the left side, there is a distinct box for "Branched-Chain Amino Acid (BCAA) Metabolism" (showing Ketolouvine and 3-Methyl-2-oxovaleric acid). - On the right side, there is a box for "Fatty Acid Metabolism (Supporting Evidence)" (showing Pentadecane and 2,6,10-Trimethyl-dodecane). ### Data Rendering: - All key protein and metabolite nodes are enclosed in clean vector boxes showing precise, legible text: the node abbreviation, Fold Change (FC) value, P-value, and Q-value, preserving all numerical data from the original image (e.g., Pyruvate FC=3.763). ### Legend and Scale: - On the far right, there is a structured "Legend" box with standard icons for up-regulation (red arrow), down-regulation (blue arrow), known metabolic pathway (solid line), and potential regulatory relationship (dashed line). - Below the legend, a horizontal "Log2(FC)" color scale bar ranges from -0.3 (blue, Down) to +2.0 (red, Up). ### Findings Banner: - At the very bottom, a styled dark blue footer banner is titled "Key Findings (Based on existing data)" and is divided into four numbered, icon-labeled summary cards, preserving all descriptive text from image_4.png. - Below the banner, a small methodological footnote is clearly visible. ### Design Requirements: - The color palette is a professional medical aesthetic (soft blue, grey, white) with distinct red and blue highlighting for up- and down-regulated data boxes and arrows. All connections must be vector-sharp and aligned, with absolutely no Chinese characters and perfect Times New Roman typography.
Modell
NANO-BANANA
Typ
Bild
Likes
0
Seitenverhältnis
1/1